Orrery
The orrery is a simple open-source application for Maemo 5 which displays the night (and day!) sky. It is nowhere near as elaborate as, for example, kstars, xephem or stellarium. It is intended to be a small, finger-friendly application, requiring no network connection. The current stable version is 3.8.x (the x just increments when bugs are fixed). The program version is shown on the "Symbol Key" page.
The source code is hosted on this github repository. The version there may not have gone through the Maemo Community QA testing. The most recent version which has been vetted by the community is available in the Maemo Extras catalog. This wiki page describes the behavior of the version of the program available in the Extras Devel catalog. At this time, that version is also in the Extras catalog.
The star database was extracted from the Hipparcos catalog. To ease the computational load, the coordinates are not precessed or nutated before being displayed. Orbital elements are used, rather than ephemerides, to calculate planet positions. Although this is less accurate, it dramatically reduces the memory footprint. The planet positions are accurate to a few arc minutes, from 3000 BC to 3000 AD. Since the scale on the default display is approximately 8 arc minutes per pixel, these small errors are imperceptible, unless a very large zoom factor is used.
[edit] The Display
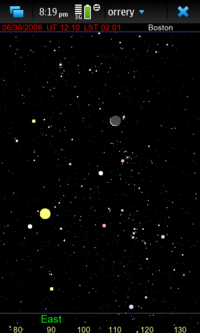
The image at right shows the default display - all stars visible to the unaided eye, with colors for the brightest ones. It's displayed with a Transverse Mercator projection (similar to Norton's Star Atlas) which works well with the N900 in portrait mode. It's a conformal transformation, so the constellations have about the right shapes. The Sun, Moon and planets are plotted, and the Moon is shown with the proper phase. The Sun and Moon are plotted with a size about 3.5 times larger than their true angular size on the sky. That allows the phase of the moon to be shown.
At the top of the display is shown, from left to right, the Universal Time (UT), the Local Sidereal Time (LST), and the location on the earth. The UT is essentially the same as the Greenwich Mean Time, and the date will also be displayed if it differs from the current date. The LST is a time based upon the position of the stars, rather than the position of the sun. The user may chose to have the program display the stars visible at the user's current location and at the current time, or at any other position on the earth, or any other time between 3000 BC and 3000 AD.
The blue line near the bottom of the display is the horizon. Nothing below that line is visible, but the program plots objects there anyway, because it is often useful to know which objects are just about to rise, and which ones have recently set.
[edit] The orrery as a compass
The green numbers at the bottom are the azimuth values. The azimuth is the angle, measured along the horizon, from north through east. So the azimuth of due north is 0, east is 90, south is 180 and west is 270 degrees. By using these azimuth values, the orrery can be used as a celestial compass, if the sky above you is at least partially clear. Notice that the azimuth values are not exactly evenly spaced. This is caused by the distortion introduced by the Transverse Mercator projection.
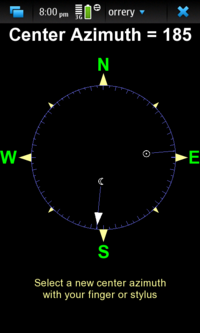
The azimuth compass which appears if you tap the bottom center of the default page shows the azimuth of the Sun and Moon, if they are currently above the horizon.
You can also use the "Planet Compass" to find directions. If the sun, moon or a planet is visible above the horizon, you can orient the azimuth portion of the planet compass with that object, and use the rest of the compass to find any other direction.
[edit] Why does this program put my phone in portrait mode?
The Transverse Mercator transformation works poorly when the phone is in landscape mode. As we all learned in school, Mercator maps of the earth become very distorted near the earth's poles. For the orrery program, that distortion is unacceptably large when the phone is in landscape mode, because the landscape aspect ratio results in too large a range of azimuth values being displayed. A future version of orrery will support landscape operation, using a different coordinate transformation for that display.
[edit] Constellations Display
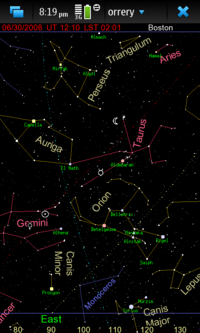
There are two sky display screens defined. By default, one of them shows the display shown at right, and the other shows the constellations, and symbolic representations of the solar system objects. Tapping the screen within the upper 4/5 of the display toggles in and out of the constellations page.
The constellations are plotted in three colors. The twelve zodiac constellations are plotted in hot pink.The constellations plotted in gold are the classical Greek constellations, as listed in Ptolomy's Almagest (apart from the zodiac constellations, which are also in the Almagest). The only constellation from the Almagest which is not plotted is Argo Navis, which is not one of the official modern constellations (Argo Navis was broken up into the modern constellations Carina, Puppis and Vela). The remaining constellations, plotted in blue, were added during the last few hundred years.
In addition to constellation names and figures, three great circles, the Celestial Equator (light yellow), Ecliptic (red) and Galactic Plane (blue-green), are shown. Solar system objects are shown symbolically (see Mercury, Venus, the Moon and the Sun in the above image).
[edit] Displaying Asterisms
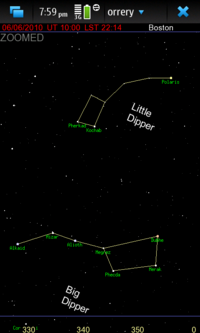
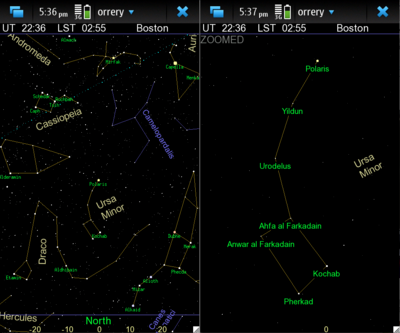
There are many informal constellations which are widely known, such as the Big Dipper, the Summer Triangle, etc. The user can choose to display some of these unofficial constellations by selecting "Use Asterisms" from the "Displayed Items" menu. If you know of some nice asterisms that the orrery does not yet display, please send them to orrery.moko@gmail.com, and I'll include them in a future release if I can. The image on the right shows the Big Dipper and Little Dipper asterisms.
[edit] Panning
The image can be panned by tapping your finger in the bottom 1/5 of the display (excluding menus). The size of the panning step is controlled by how close your finger is to the edge of the display. The program tries to center the azimuth value near where you tap. If you tap near the left or right edges, it pans by the maximum allowed amount, +-40 degrees. Pan steps are quantized in increments of 5 degrees.
[edit] Selecting a New Center Azimuth
Panning to a new central azimuth by panning 40 degrees at a time can be tedious. To make a large change in the display's center azimuth you may use the azimuth compass. To call up the azimuth compass, tap near the center of the finger-pan area (bottom 1/5 of the display). The compass shown at right will appear:
The locations of the Sun and Moon are shown if they are above the horizon (if they are too close together, only the Sun is shown). You may use your finger or stylus to select another center azimuth. Keep you finger pressed to the display as you select your new center azimuth - the selected azimuth will be shown by a white pointer on the inside of the compass circle. Once you release pressure on the screen, the compass will disappear, and the display will be redrawn.
The azimuth compass cannot be accessed if the display is zoomed.
[edit] Main Menu
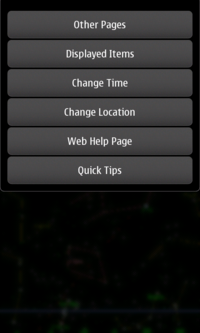
The main dropdown menu for the orrery has six options:
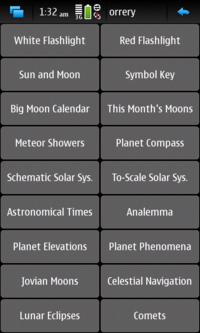
[edit] Other Pages
The "Other Pages" option takes you to a menu that allows you to display things other than the night sky. With the exception of the flashlight pages, which are dismissed by tapping anywhere on the screen, the "Other Pages" are dismissed by curved arrow in the upper right hand corner.
[edit] Flashlight Modes
The "White Flashlight" button paints the entire screen white, and the "Red Flashlight" button paints the entire screen red. Both may be used as a flashlight, but the red one is best if you are trying to preserve your night vision.
[edit] Sun and Moon
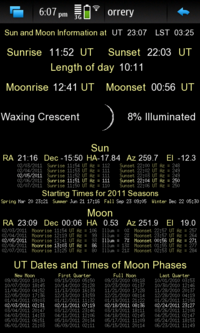
The "Sun and Moon" button displays a page giving the sun and moon positions, rise and set times, phase, etc. for five days, centered on today.
The highlighted date is the current UT date (unless the time menu has been used to select a different time). The highlighted rise and set times are the next ones which will occur at your location. Of course, that may be on a different UT date (for example, during daylight hours, the next sunrise will be tomorrow). The times are shown as UT, which may annoy people. UT is used because the orrery allows you to select any location on the earth, and any time from 3000 BC until 3000 AD. It would be very difficult to keep track of all the timezone, daylight savings change dates, etc. for that time range! So I have wimped out, and displayed UT, which is always reasonably well defined.
The current sun and moon positions shown are geocentric - no topocentric correction has been applied. However topocentric corrections are applied when rise and set times are calculated, so they should be reasonably accurate for a specific location on earth.
The moon illumination percentage shown on the line with the rising and setting times is the value at transit. The illumination shown on the line that has the drawing of the moon phase is the illumination percentage at this moment.
This page also shows the UT date and time of the four major moon phases (New, First Quarter, Full and Last Quarter) for a time span of 10 lunar months, centered on the current time (which of course can be changed with the time menu). The nearest time and date when each phase will occur is highlighted.
[edit] Seasons
The Sun and Moon page also displays the precise times at which each of the four seasons begins (spring and autumn equinoxes, summer and winter solstices).
[edit] Symbol Key
This button displays an annotated list of all the symbols used on the orrery display.
[edit] Big Moon Calendar
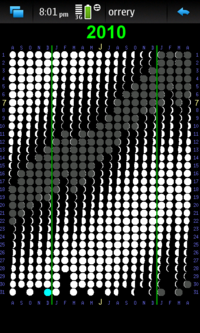
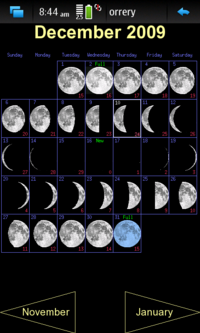
The Big Moon Calendar is a graphic display of the phase of the moon for each day from 10 months before the current month, until 10 months after the current month (roughly 640 days), as shown at right.
Each column shows one month, and the day number is shown for each row. At the top and bottom of each column is shown the first letter of the name of the month shown in the column. Two vertical green lines separate years. The current Universal Time date is outlined in a red box.
[edit] This Month's Moons
The This Month's Moons page shows the phase of the moon for each day of a particular month. By default, the current month is shown, but one may use the arrow buttons to pan through the months. The day of the calendar month is shown in blue in the upper left corner of each day, and the number of days since the last New Moon (the "age" of the moon) is shown in red at the bottom right corner. The current day is highlighted with a white box with the day of the month in white and the age of the moon in pink.
Both moon calendars show "Blue Moons", which are (according to the most commonly used definition) the second full moon in a calendar month which has two full moons. Both images at right show the Blue Moon which falls on New Year's Eve, 2009.
[edit] Meteor Showers
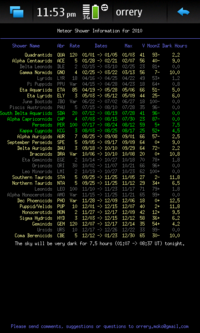
This display shows information for all the meteors showers which will occur during the current year. Remember that to see a meteor shower, you must travel to a site that has a very dark sky. In a city, few meteors will be seen even during a shower.
The items shown on the Meteor Showers page are:
- the name of the meteor shower
- the abbreviation used for this shower when its radiant is plotted on the sky display
- the expected number of meteors per hour - this is the maximum you will see under the best circumstances with a very dark sky and the shower radiant directly overhead on the date of the shower maximum. If the rate entry says "Var", that means the rate is variable; such shower are not apt to show a large number of meteors per hour.
- the range of dates during which the shower will occur
- the date at which the shower shows the maximum number of meteors
- the typical velocity of the showers meteors in km/sec - larger numbers lead to brighter, bluer meteors
- the percentage of the moon's disk which is illuminated on the date of shower maximum - full moon = 100%. A minus sign following the percentage means the moon is waning, a plus sign means it is waxing. Moonlight greatly interferes with seeing meteors
- the number of dark hours on the date of the shower maximum - defined as the time during which the sun is more than 12 degrees below the horizon, and the moon is far enough below
the horizon to not appreciably brighten the sky.
The Meteor Showers page shows information for all showers, the large majority of which are really minor events. Even when a meteor shower is not occurring, you can expect to see 4 to 10 meteors per hour. Many of the showers listed do not even double that background rate, and are of interest only to serious meteor enthusiasts. If you just want to go out and see some meteors for fun, it's best to select a shower with a rate of at least 50 meteors per hour, and to watch it on or very near the date of the shower's maximum.
Each line of the display describes a separate shower. If the shower currently in progress, the line is shown in green - bright green if there will be 2 or more hours of dark sky tonight, and dark green otherwise. If the shower is not currently underway, it will be shown in a cream color if on the night of the shower's maximum, the sky will be dark for at least 2 hours. Otherwise the shower information will be shown in grey, indicating that this year is not a good one to observe that particular shower.
At the bottom of the Meteor Showers page is shown the number of dark sky hours to expect tonight. In this context, "tonight" means the upcoming night if the sun is currently above the horizon, or the current night, if the sun is below the horizon.
If you wish to get meteor shower information for a different year, simply change in year using the time menu.
Many thanks to the International Meteor Organization (http://www.imo.net/imo/intro) for permission to use their data to produce the meteor shower related displays.
[edit] Planet Compass
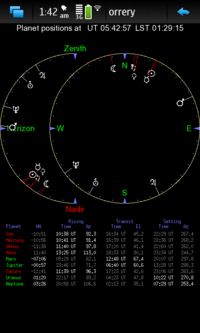
The Planet Compass page graphically shows where each of the planets is at the current time.
The image has one complete circle, which shows the planet azimuth, and one semicircle, which shows the elevation.
The azimuth circle has blue triangles marking the four cardinal points: North, South, East and West. There are small tick lines at the NE, SE, SW and NW directions, as well as a small dot every 10 degrees. The planet symbols are shown with lines projecting to their current azimuth. The line is white if the planet is above the horizon, and red if it is below the horizon.
The elevation semicircle has blue triangles marking the directions of the Zenith, Horizon and Nadir. Small dots are shown every 10 degrees, and there are short lines at +-45 degrees. As with the azimuth circle, lines connect the planet symbols to their current elevations.
Below the compass graphic, the name, Hour Angle (HA) rising time and azimuth, transit time and elevation, and setting time and azimuth is shown for each planet. The name of the planet is shown in green if the planet is currently above the horizon, or red if it is not. The time of the next event - rising, transiting or setting, is also highlighted for each planet.
[edit] Solar System
The program can display the relative planet positions in two different ways. In both cases, the view is from the north looking down, with the direction of the Vernal Equinox to the left of the screen (marked with the vernal equinox symbol, and an arrow). At the time of the vernal equinox, the earth will be at the 3 o'clock position in its orbit, so that the Sun will appear at the vernal equinox position.
[edit] Schematic Solar System View
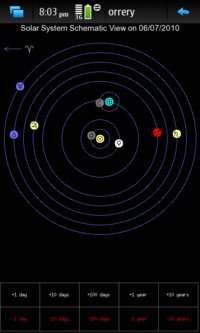
This button presents a schematic view of the Solar System, showing the locations of the earth, the earth's moon and the other planets in their orbits around the sun. The view is schematic in the sense that the orbit radii and planet sizes are not shown to scale. However the positions of the objects within their orbits are correct (the heliocentric ecliptic longitudes are correct).
Several buttons are drawn at the bottom of the display, which allow you to show an animation of the motion of the Solar System objects for several time increments. Showing the motion of planets in this way is what mechanical orreries do.
[edit] To-Scale Solar System View
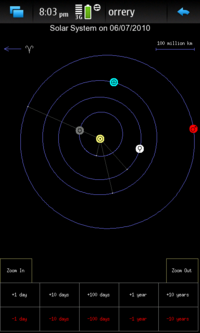
This button displays the Solar System with the planet orbits shown with
the proper relative sizes. The orbits are also plotted as ellipses in this display, with the correct eccentricity and orientation. The moon is not plotted, because it would be too close to the earth to display if any of the planet orbits were completely shown. Because Neptune's orbit is nearly 100 times larger than Mercury's, it is not possible to display all of the planet orbits simultaneously. There are "Zoom In" and "Zoom Out" buttons which allow you to select which proper subset of planet orbits is shown. The current position of each planet in its orbit is shown. Also plotted are grey lines connecting the Sun to each orbit, terminating with a white dot at the position of the planet's perihelion (where it is closest to the sun in its orbit). The image at right shows the display when the outermost plotted planet is Mars. Note that the orbits of Mercury and Mars are quite non-circular.
[edit] Astronomical Times
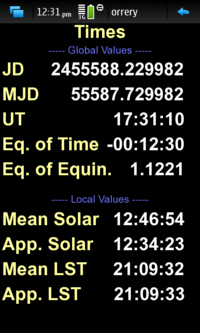
This button displays the current value of several astronomically important time scales, including the Julian Date (JD), the Modified Julian Date (MJD), which is simply the JD - 2400000.5, the Universal time (UT), the Equation of time (Eq. of Time), which is the difference between mean solar time and sundial (apparent) solar time, and the Equation of the Equinoxes (Eq. of Equin.), which is the very small difference between the Mean Sidereal Time, and the Apparent Sidereal Time. All of those values are the same anywhere in the world. Also displayed are several times specific to the location you are at (or have selected): The Mean Solar Time, the apparent solar time (the time shown by sundials), the Mean Local Sidereal Time (Mean LST) and the apparent local sidereal time (App. LST). Unlike the other orrery pages, this page is updated rapidly (at 10 Hz), so that you can see the exact current values.
[edit] Analemma
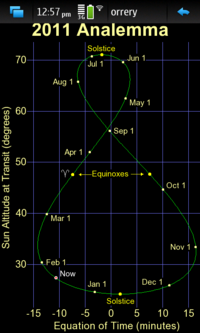
This button displays the Analemma for the current time, or the time which has been selected with the Change Time button. The analemma's horizontal axis is the Equation of Time value, which is the difference between Mean Solar Time (what a clock set to your local time, not your timezone time, would show) and the Apparent Solar Time (what a sundial would show - the time defined by the position of the real sun in the sky). The vertical axis shows the elevation of the sun above the horizon, at noon, from your location (or the location you have selected). The analemma is labeled with a year, because it slowly changes as the earth's orbit changes and the earth's pole wobbles. No phone can really be called a smartphone if it cannot show the analemma. The analemma page takes a second or two to display - nearly 750,000 trigonometric function calls are needed to calculate it accurately!
When the Equation of Time is negative, clocks run ahead of sundial (apparent solar) time.
If you were to photograph the sun, at the same time each day, the resulting set of sun images would trace out the analemma. The analemma can be used to calculate the direction of the sun's rays at your location.
[edit] Planet Elevations
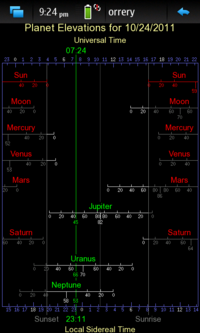
The "Planet Elevations" page offers another way of seeing if and when the planets will be visible. A typical display is shown at the right. The page shows a plot of one full day, with time increasing as you move to the right of the plot. The Universal Time is shown at the top of the plot, and the Local Sidereal time is shown at the bottom. The grey line in the center of the plot marks local midnight (which, in general will not be timezone midnight). There is a horizontal line drawn for the Sun, the Moon and each of the planets (except earth!). The line for the sun is drawn in red; for other objects the portion of the line which is drawn in white shows when the object is above the horizon at night and the portion shown in grey shows when the object is above the horizon during daylight. Below each object's line is shown a series of tick marks with the elevation of the object at that time shown below. Below the center of each object line, the elevation of the source at transit is shown. There are grey vertical lines shown covering the entire height of the plot marking sunrize and sunset. In between those lines, the Sun is below the horizon, and a planet may be visible. There is a colored vertical line, with a UT time at the top and an LST at the bottom. That line shows the current time, and it is red if the Sun is above the horizon, yellow during twilight, and green when the sky should be pretty dark. If that line intersects an object line (in the plot shown here, it intersects the lines for Mars, Jupiter, Uranus and Neptune) that object is above the horizon, and the object's current elevation is shown next to the current time line (in this case, 2 degrees for Mars, 58 for Jupiter, 44 for Uranus and 18 degrees for Neptune). If the sky is dark, and the object is above the horizon, its name is shown in green. Otherwise, it is shown in red.
One can obviously change the time on using the orrery's "Change Time" menu item, and then use this page to see the range of time that any planet will be visible for, at any time from 3000 BC until 3000 AD.
One little wrinkle for this display is when to update the tracks for the next day. In other words, if an object is currently below the horizon, is the elevation track shown correct for today, or tomorrow, or yesterday? This doesn't really matter for anything other than the Moon, because no other object moves on the sky enough during one day to make its track change significantly. But a one day change in the Moon's position is very significant. The way the orrery handles this is to switch to the next day's tracks at local noon. So once noon passes, the tracks will be correct for the night which begins at the next sundown. Before local noon, the tracks are correct for the night which ended at the most recent sunrise. This means that the tracks should be correct at all times when the sun is down.
[edit] Planet Phenomena
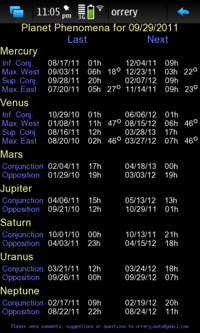
The "Planet Phenomena" page shows the date and hour of the most recent and next conjunction and opposition (for superior planets). For inferior planets, the inferior and superior conjunction dates are shown, along with the date of greatest eastern and western elongation, and the separtion from the Sun on those dates. Mercury and Venus are most easily observed around the date of greatest elongation. In fact, it's virtually impossible to see Mercury with the unaided eye, except very near the time of greatest elongation. When Mercury or Venus is at greatest eastern elongation (labeled "Max. East" on the table) the planet is visible after sunset in the evening. Near greatest western elongation (labeled "Max. West") it is visible before sunrise in the morning.
The dates and times shown on this page have an accuracy of about +- one hour.
[edit] Jovian Moons
The Jovian Moons page displays information about the positions and phenomena for the four largest moons of Jupiter - the Galilean Moons. These moons are easily seen with even small binoculars. Some sharp-eyed people claim to be able to see them with their unaided eyes. The moons are easily bright enough to be seen with the unaided eye, and at least the outermost two get far enough away from the planet's disk to be resolved by a human eye. But the dazzling brilliance of Jupiter so near the moons makes viewing them without optical aid very difficult.
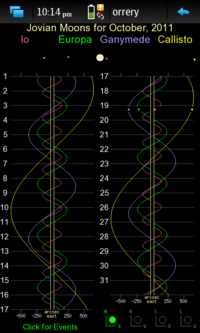
A screenshot of the Jovian Moon first page is shown on the right. At the top of the page is a plot showing Jupiter and
its four main moons, which are color coded for easy identification, in their proper positions for the current time (or any other time you set). All four moons will not always be visible - sometimes they pass behind Jupiter and are
blocked from our line of sight. Occasionally the shadow of one of the moons will pass across Jupiter's disk, and that shadow too will be shown in the plot.
Because the inclination of Jupiter's axis is only 3 degrees, and the moons orbit nearly in Jupiter's equatorial plane, these moons appear to move nearly on a line, with Jupiter in the center. Eclipses for the three innermost moons happen very frequently, and Callisto, the outermost Galilean Moon, is eclipsed less frequently. Which side the moons appear on depends upon what equipment you use to observe them. Many telescopes invert or mirror reflect the image.
There are four buttons near the bottom of the page which allow you to
invert and reflect the plots, to make them match what you see with your equipment.
Most of the page is taken up with "wiggly line" plots which show the east-west positions of the moons throughout the current month. They are color coded, for identification. At the position in the plot corresponding to the current time, the lines are interrupted, and dots representing the moons are plotted. Although these lines look like simple sine waves, they are not. The moons (and other objects) perturb the orbits o these moons, making the motion far more complex than simple harmonic motion. The two cream-colored vertical lines in each plot shows the size of Jupiter's disk. You can see on the plot when a moon passes in front of or behind Jupiter. There is a scale at the bottom of the plots which allows you to see the separation in arc seconds. This scale changes as the distant to Jupiter from the Earth changes.
At the bottom of the page is a button you can press to go to the "Events" page.
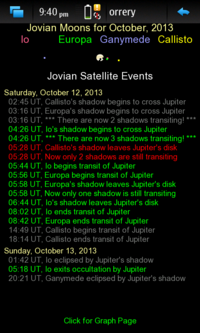
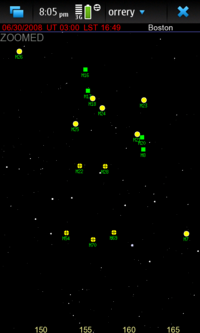
The Events page lists the times of the satellite events such as eclipses, occultations and transits. This page takes a second or so to plot, because it requires roughly one million double precision trigonometric functions to be evaluated (the event timings are calculated by your phone, not fetched from a website). Since the app is location-aware, it can tell you which of these events will be visible to you from your current location. If the Sun is above the horizon, or Jupiter is below the horizon, you cannot see a satellite event; such events are listed in grey. Events that you can see are shown in green, except for he next event you can see, which is shown in red. The times are all in UT, of course. The plot on the right shows the events for the very special evening of Oct 12, 2013. On that night three satellite shadows crossing Jupiter's disk are visible at once (see plot at the top of the page). The color coding shows that this rare triple shadow event will be visible from my current location.
At the bottom of the Events page is a button you can click to return to the Graph page.
[edit] Celestial Navigation
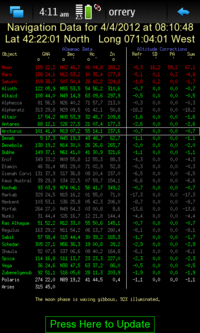
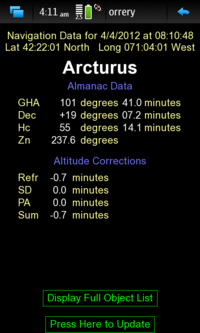
The Celestial Navigation page shows the information needed to perform celestial navigation calculations with a sextant. The default page, shown on the right, shows the information presented by the US Naval Observatory on its online calculator (located at http://aa.usno.navy.mil/data/docs/celnavtable.php). The orrery does not use that Naval Observatory calculator; it calculates the values itself (so you do not need an internet connection to use it). The orrery uses the same list of objects as the Naval Observatory calculator, but it color-codes them differently for improved visibility. Solar System objects are shown at the top of the list in red. Objects with elevations between 15 and 65 degrees are shown in green, and objects above the horizon but outside of that range are shown in grey. Data for Polaris and the First Point in Aries are shown at the bottom of the table, in white. The values are not updated as time passes unless you press the "Press Here to Update" button at the bottom of the page.
If you need the reduction table values for some arbitrary time, you can of course use the normal method of changing the orrery's time, and then return to the Sextant Navigation page to see the appropriate values.
Showing all of the navigational objects on one page requires a very small font, which is hard to read. If you press the touchscreen near any of the objects, a white box will appear highlighting a selected object. Releasing the screen will present another page showing the data for the selected object only, with a much larger, more readable font, as shown on the right.
[edit] Lunar Eclipses
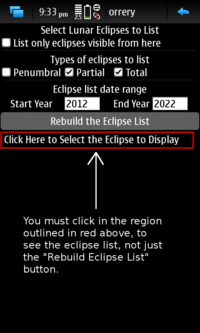
The orrery can display information about every lunar eclipse occurring from from 1999 BC through 3000 AD - a bit more than 12000 eclipses (the database used is the "Five Millennium Canon of Lunar Eclipses: -1999 to +3000" available at http://eclipse.gsfc.nasa.gov/SEpubs/5MCLE.html, although the orrery generates its own maps). It will display information about the visibility and duration of the eclipse as seen from the current location. When one selects the Lunar Eclipse page, the checklist page shown on the right is presented. Because so many eclipses can be displayed, by default the user is presented with a small subset of the eclipses: those which occur during the next 10 years. One may change the starting and ending years to access other eclipses. The "List only eclipses visible from here" checkbox allows you to produce a list of only those eclipses for which at least some portion of the eclipse is visible at your location. Other checkboxes allow you to decide which types of lunar eclipses; penumbral, partial and/or total, you wish to display. By default penumbral eclipses are not displayed, because they involve only a rather subtle changing of the moon's illumination. If you change any of the selection criteria on this page, you need to tell the program to generate a new list of eclipses to display by pressing the "Rebuild the Eclipse List" button. If you don't change the checkboxes, you do not need to push that button. To select the eclipse you wish to observe, click the "Click Here to Select the Eclipse to Display" area, and you will be presented with a scrollable list of eclipses to choose from. You will not be presented with an eclipse list unless you click in that region (shown outlined in red, in the screenshot to the right).
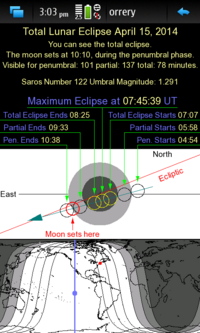
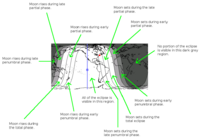
The upper graphic on the eclipse display page shows the path of the moon through the earth's shadow. The penumbra (where the earth only partially blocks the sun as seen from the moon) is shown in light grey and the umbra (where the earth completely blocks the sun as seen from the moon) is shown in darker grey. The ecliptic is shown in red, and the path of the moon is indicated with a turquoise arrow. If the moon rises or sets at your location during the eclipse, the moon's position in the shadow at that time is shown in red.
[edit] Comets
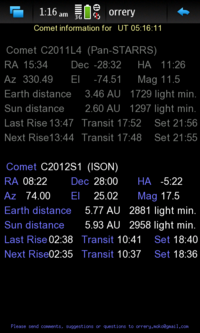
The Comets page displays information about any comet(s) that the app knows about. An example of the display produced is shown on the right. Information for comets which are currently below the horizon is shown in grey (as is the case for comet Pan-STARRS in the sample page).Unlike the major planets, comet information for orrery is obtained from ephemerides obtained from the JPL Horizons website. Ephemerides are used for comets because their orbits may be strongly perturbed by the major planets as the comets move through the inner Solar System. Since ephemerides are used, the orrery can only display information for a comet during the period covered by the ephemeris, usually one year before and after the periheion passage. Outside of that period the comet is ignored and not plotted anywhere.
In addition to the Comets page, comet information shows up several other places. The comet will be plotted on the sky map page (default page) if showing comets has been enabled via the Displayed Items menu page. Comets will also be shown on the Planet Compas page, the Planet Elevations page and the To-scale Solar System page. Note that if their are comets visible, there will be a button in the upper left area of the Planet Elevation page allowing you to toggle between showing planets and showing comets.
The To-scale Solar System page shows the orbits projected onto the Solar System's equatorial plane. Since comets follow paths that are often very highly inclined to that plane (as is the case for comet Pan-STARRS), this projection effect can make it look like the Sun is not at the focus of the orbit, but of course it must be. This is merely an illusion.
[edit] Adding Additional Comets
You can add more comets for the orrery to display. To do so, you need to create an ephemeris file. The file must have the following format:
The first line must contain the name of the comet, optionally followed by a second "nickname" for the comet.
All other lines must be formatted as follows:
Character Range                        Description
 0 ->  3                           Year (2012, etc)
 5 ->  7                           Month (Jan, Feb, etc)
 9 -> 10                           Day of month
12 -> 13                           Hour
15 -> 16                           Minute
18 -> 28                           Geocentric RA (HH:MM:SS.SS)
30 -> 40                           Geocentric Dec (+DD:MM:SS.SS)
43 -> 47                           Magnitude (MM.MM)
49 -> 56                           Ecliptic Longitude (DDD.DDDD)
58 -> 65                           Ecliptic Latitude (+DD.DDDD)
67 -> 79                           Distance from Sun (AU)
This information can be easily obtained from the JPL Horizons website. For the ephemerides I include with the package, I have one entry for every time the comet moves by one degree in the sky, so the sampling is much finer near perihelion. The file must be placed in the directory /opt/maemo/usr/share/orrery/comets/ . The name of the file does not matter.
[edit] Displayed Items
The "Displayed Items" page allows you to configure the display, selecting such things as the faintest magnitude object displayed, whether constellation lines are plotted, whether or not star names are displayed, etc.
[edit] Deep Sky Objects
If you select "Deep Sky Obs" from the "Displayed Items" menu, you will be shown some of the brightest Deep Sky Objects. Deep Sky Objects are objects such as galaxies, expelled envelopes of dying stars, clusters of young stars and luminous gas. A few, such as the Andromeda Galaxy, are visible to the unaided eye. Many more are visible with binoculars or a small telescope. The orrery shows all Messier objects, and many other well known bright nebulae and star clusters. The image bellow shows the Messier objects in Sagittarius.
[edit] Adding Your Own Deep Sky Object List
You may add your own list of deep sky objects to be plotted. Simply create a file within the directory /usr/share/orrery/deepSky/ with any name. The file should contain lines of text with the format:
name HH MM SS.SS DD MM SS.S type mag
where name is the object name, which may not include white space, HH MM SS.SS is the Right Ascension, DD MM SS.S is the declination (do not include a + sign for positive declinations) "type" is an integer specifying the type of object:
- 0 = Supernova Remnant
- 1 = Globular Cluster
- 2 = Open Cluster
- 3 = Diffuse Nebula (HII region, etc.)
- 4 = Planetary Nebula
- 5 = Galaxy
The "mag" is the visual magnitude. The orrery program currently does nothing with the visual magnitude, but future versions may use it.
[edit] Meteor Radiants
If you select Meteor Radiants, then the radiant position for any meteor showers which are now occurring will be plotted. The radiant is the position in the sky from which meteors seem to emerge during a shower - it's the best place in the sky to look for meteors.The radiant is plotted in white if more than 50 meteors per hour are expected under optimal viewing conditions, cream-color if 20 or more meteors per hour are expected, and grey if fewer then 20 meteors per hour are expected. Note that these are meteor rates for the date of the shower maximum - see the Meteor Showers page for more information. The radiant position usually changes as the shower progresses. The orrery takes that into account when plotting the radiant.
[edit] Changing the Magnitude Limit
The magnitude scale for expressing the brightness of stars and planets is explained in this Wikipedia article. It is one of the oldest measurement systems still in use today.
By default, the orrery displays every star a person with excellent eyesight located in a very dark area on a moonless night can see. If your observing conditions are less ideal than that, it can be helpful to use the "Mag. Limit" field in the item menu to lower the limit of the faintest object plotted.
[edit] Star Names
Selecting Star Names will cause the traditional, western names for stars to be displayed. Most of these names are corrupted versions of ancient Arabic names. If you zoom the image, more names will be shown.
[edit] Bayer Designations
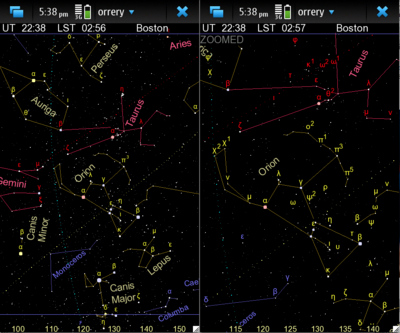
As an alternative to displaying the names of the bright stars, you can instead display the Bayer Designations. These are the designations using Greek letters, like the well-known "Alpha Centauri". It is recommended that you do not display both the star names and Bayer designations at the same time, because the display will become rather crowded. As with star names, if you zoom the display, more Bayer designations will become visible, as shown at right.
[edit] Change Time
The "Change Time" page allows you to specify an explicit time between 3000 BC and 3000 AD, or the current time. If "Now" is selected, the current time is used and the display updates automatically once per minute. If a specific time is selected, it is shown in red, to remind you that the display is not going to update automatically as time passes. The time may be specified as a calendar date, or as a Julian Date.
If the Calendar checkbox is selected, you can choose the date and time (UT) using the normal Hildon selector widgets for these quantities. Note - this option only allows dates from 1900 to 2100 AD to be selected. To chose a date outside that time range, you must use the Text Entry option.
The Julian Date is a less ambiguous way of entering times in the distant past than using a calendar date, because of the differing calendar systems in use worldwide before the late 16th century. For example, the date October 10, 1582 never occurred in some European countries. Many countries have gaps in their calendars with missing dates when they adopted the Gregorian Calendar.
Note about the Text Entry option: At this time, the numeric fields can only be changed with the keyboard's up/down arrow keys, or with text entry via the soft keyboard.
[edit] Change Location
This page allows you to select the position of the observer on the earth's surface. You can use the position derived by the N900 itself (either from cell tower coordinates or GPS), a user specified latitude and longitude, or a location selected from a menu.
If you chose the "Phone" option, the most recent position derived by the N900 will be used. If the phone has not yet established a position, the default location will be used until the phone has derived a position.
If you choose the "Custom" option, you may enter a new position by typing text into the "Name" field, and using the "Longitude" and "Latitude" selection widgets. Don't forget the "West", "East", "North" and "South" buttons - they select the sign of the latitude and longitude. Once you've entered a new custom position, you'll be given the option of saving it in your private catalog.
To choose a predefined position from a menu, select the "Menu" option near the bottom of the page. You will notice that the "Region" menu will then become highlighted. Push "Region", and then select the continent or category of the area you want the sky to be shown for. Once you have selected a region, a pull-down menu with the name of that region will appear next to the "Region" button. Use that new menu to select your city. After the city is selected, its name will appear next to the regional menu.
If you select a "Custom" or "Menu" location, a button labeled "Save in Private Menu" will appear. After you select your new position, you may push that button to save it in the menu labeled "Private". That menu is initially empty.
If you would like to add additional cities, etc. to one of the menus other than the private menu, you may simply edit one of the menu files, and add the name, latitude and longitude of the location. The lists of locations are stored in ASCII text files under the menus subdirectory of the program installation area on your phone. You will need to reload the "Change Location" page for your new locations to become available.
[edit] How to change the default location from Boston
To change the default location, just use the "Change Location" menu option to select a new location as described above. That will make the currently selected position your new default location, which will be used whenever the program is started, unless "Phone" is selected as the source for position information.
[edit] Web Help Page
This button brings up this wiki page in the browser, provided you have a network connection.
[edit] Quick Tips
This button brings up a page with a few basic instructions for operating the program. It does not require a network connection.
[edit] Minimized Display
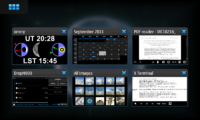
When the orrery window is minimized by the N900's window manager, it produces a different display which is legible even when the window is in its shrunken state. The image at the right shown this minimal mode, when the N900 is in landscape mode. It shown the phase of the moon in the center, and plots indicating the Sun (far right plot) and Moon (far left plot) azimuth (outside triangle) and elevation (inside arrow). The triangle and arrow are green if the object is currently above the horizon. At the top of the display, the UT is shown, and the bottom of the display has the LST. These are continuously updated.
In portrait mode, the minimized display shows the names of each planet that is currently above the horizon (not including uranus and Neptune, which are not visible to the unaided eye). The elevation of the planet, in degrees, is also shown, in green if the source has not yet passed through transit, and red otherwise.
[edit] Touchscreen Gestures
There are four types of touchscreen gestures which you can make in the plotting area which are recognized by the orrery: Taps, Zooms, Pans and Presses.
[edit] Taps
If you press the display area, and withdraw your finger or stylus within 0.25 seconds, that gesture is considered a tap. Tapping in the lower 1/5 of the display area will pan the display in azimuth. Tapping anywhere else toggles between the default screen and the constellation screen.
[edit] Zooms
If you press the screen and trace out a roundish figure, and remain in contact with the screen for more than 0.25 seconds, and if the figure encloses a nontrivial (> 300 pixels) area, the gesture is considered to be a zoom. As you move your finger or stylus, the region you are outlining will be shown as a green dotted line. After you release your finger from the display, a red box will be shown. The red box is a rectangle with the aspect ratio of the display area, and the same area and centroid as the region you traced out with your finger. The display will then be zoomed so that the region in the red box fills the display area.
Zooming can do some non-intuitive things, especially if you zoom near the upper left or upper right of the display. This is because the orrery's transverse mercator projection always has a line of constant azimuth in the center. This means that something zoomed at the edge of the display area will be rotated as it is zoomed, and some of the stars you wish to display may be rotated out of the display area. It is best, especially if you are zooming in on an area near the zenith, to first pan the display so that the region is near the center of the display, before zooming. The nice thing about the transverse mercator projection is that a zoomed area is displayed with the orientation it would have if you were directly facing it at the time indicated by the display.
If your zoom area includes the zenith, the display may do weird things. This is a bug.
To unzoom - just press the screen for longer than 0.25 seconds, without moving your finger (much).
[edit] Pans
A pan is like a zoom, but with a more linear, rather than roundish gesture. A pan can be used to move the center of a zoomed region. It has no effect if the display area is not zoomed. After you release your finger or stylus following a zoom gesture, orrery will show the region you traced out in green, and will draw a red arrow showing the direction and size of the pan. After that, the display is re-drawn with the new center position.
[edit] Presses
If you push down on the touchscreen for more than 0.25 seconds, and do not move your finger or stylus significantly while making contact, you will have made a press gesture. Since one almost always moves one's finger a little by while pressing the screen, some small motion is allowed during a press gesture. This means that a zoom or pan gesture cannot be arbitrarily small, because it will be interpreted as a press.
If the screen is zoomed, then the press gesture unzooms it. If the screen is already unzoomed, then the press gesture has the same effect as a tap gesture.
[edit] Symbols
[edit] Symbol Key
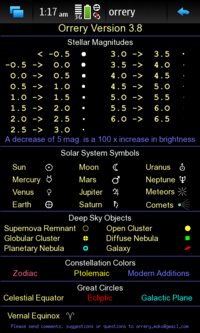
If you select "About Orrery / Symbol Key" from the "opts" menu, you will be shown an annotated list of the symbols used by the orrery, which is reproduced at right.
NOTE: the current version is 3.5.
[edit] Planet Symbols
The solar system symbols, used by default on the constellation page (screen two), are the standard astronomical symbols for these objects. They are explained on Wikipedia.
[edit] Plotted Lines
The dotted yellow line is the Celestial Equator, the intersection of the Earth's equatorial plane with the celestial sphere. The red dotted line is the Ecliptic. The Ecliptic is the intersection of the Earth's orbital plane with the celestial sphere. The Ecliptic is also the path of the Sun across the sky, and the intersection points between the Celestial Equator and the Ecliptic are where the Sun is at the time of an equinox. Constellations lying along the Ecliptic plane are zodiac constellations. The planets and the Moon are always near, but usually not exactly on, the Ecliptic. The blue-green dotted line is the Galactic Plane, the intersection of the plane of the Milky Way's disk and the celestial sphere.
[edit] Displaying Stars Too Faint for the Unaided Eye to See
The default sky catalog used by the orrery contains every star you can see with your unaided eye, even if you have exceptionally good eyesight, and are located in a very dark area on a moonless night. If you wish to display stars which require binoculars or a small telescope to be seen, you can download the file hipparcos_9.0.dat from the orrery area of the gForge site.
You must load this file onto your phone, of course, but you probably will want to store it on the removable microSD card, because the file is so large (3 megabytes). You must make a softlink in the top of the orrery files area called "faintStars", which will point to where the hipparcos_9.0.dat is actually stored. For example, if you do the default installation of the orrery, and if you store the hipparcos_9.0.dat at the top directory of your microSD card, you must issue the following command to make the faint star catalog usable:
ln -s /media/mmc1/hipparcos_9.0.dat /usr/share/orrery/faintStars
You must restart the orrery after making this softlink.
Once the new catalog and softlink are in place, the orrery will allow you to change the maximum magnitude (using the "Displayed Items" menu option) all the way up to magnitude 9.0. Note that the default, smaller catalog is still used if the maximum magnitude is no larger than 6.6, so you may used the orrery with the faint star catalog, and not incur and performance penalty as long as you restrict yourself to stars no fainter than 6.6. The faint (mag > 6.6) stars cannot be displayed in constellation mode.
The default orrery star catalog contains 9931 stars. hipparcos_9.0.dat contains 83392 stars, and is complete to 9th magnitude. The orrery will be more sluggish if you choose to display stars fainter than 6.6, because it must process the larger star catalog.
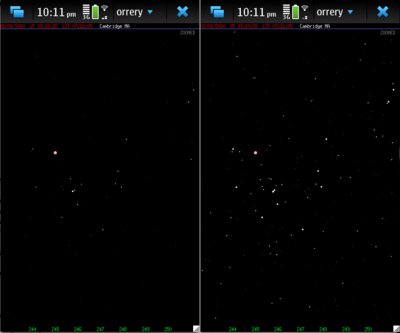
The plot below shows Hyades star cluster with limiting magnitudes of 6.6 (left) and 9.0 (right).
Remember, there's no reason at all to install the hipparcos_9.0.dat file unless you plan to do star gazing with binoculars or a small telescope.
[edit] Chinese Color Scheme
In traditional Chinese astronomy, the zodiac is known as the Yellow Way, and the celestial equator is known as the Red Way. If you want the orrery to use that color scheme for great circles and constellations, edit the file /usr/share/orrery/config, and make the first line read
CHINESE_COLOR_SCHEME 1
You will need to restart the program.
[edit] Bugs! (and some workarounds)
[edit] Preserving the Private Catalog
If you installed the first version of the orrery program (3.0.x), and if you made location entries in the "Private catalog", upgrading to the 3..1.3-1 version will delete your "Private catalog", and all your saved locations will be lost. You may prevent this by using "X Terminal" to issue the following commands before upgrading:
mkdir /home/user/.orrery
cp /opt/maemo/usr/share/orrery/menus/Private /home/user/.orrery/
[edit] Contact Information
Please send comments, suggestions, questions and/or abuse to orrery.moko@gmail.com
- This page was last modified on 29 October 2012, at 22:07.
- This page has been accessed 311,611 times.

