MaeFat
| Line 15: | Line 15: | ||
[[Image:maeFatDataEntry.png|thumb|200px|alt=maeFat Data Entry|Data Entry]] | [[Image:maeFatDataEntry.png|thumb|200px|alt=maeFat Data Entry|Data Entry]] | ||
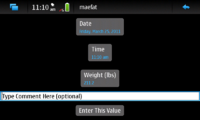
The Data Entry page allows you to enter new weight data. It does that without requiring you to use the N900's keyboard. It contains hildon Date and Time widgets preloaded with the current time and date. You can use these to change the time tag for the weight data you are entering, if you don't want to use the current time. The Weight widget is used to enter the weight. If no data has yet been entered, it will be preloaded with 150 pounds (unless you chosen metric units), otherwise it will be preloaded with the most recent weight entry. The comments widget allows you to tag the entry with a text comment. If you press the arrow at the upper right corner (the normal way to exit a page) the new data will be entered into the log. If you decide that you don't want to make an entry, push the Cancel Data Entry button. | The Data Entry page allows you to enter new weight data. It does that without requiring you to use the N900's keyboard. It contains hildon Date and Time widgets preloaded with the current time and date. You can use these to change the time tag for the weight data you are entering, if you don't want to use the current time. The Weight widget is used to enter the weight. If no data has yet been entered, it will be preloaded with 150 pounds (unless you chosen metric units), otherwise it will be preloaded with the most recent weight entry. The comments widget allows you to tag the entry with a text comment. If you press the arrow at the upper right corner (the normal way to exit a page) the new data will be entered into the log. If you decide that you don't want to make an entry, push the Cancel Data Entry button. | ||
| + | |||
| + | == Settings == | ||
| + | [[Image:maeFatSettings.png|thumb|200px|alt=maeFat Settings|Settings]] | ||
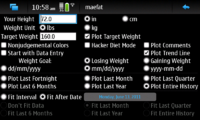
| + | The Settings page allows you to change how the program operates. It must be used initially to enter your height. Before entering your height, you should select centimeter units if that's what you wish to use (rather than inches). You may also select metric units for weight, and the format for displaying the dates. If you select nonjudgemental colors, neutral colors will be used to display the data, otherwise green will be used to indicate weight loss, red will be used for weight gain, and the BMI data will be color coded. The last thing the Settings page allows you to set is the time interval used to produce the default plot page. | ||
| + | |||
| + | == Plot Page == | ||
| + | [[Image:maeFatPlot.png|thumb|200px|alt=maeFat Plot|Plot]] | ||
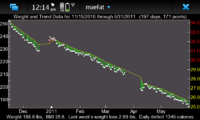
| + | The program's default page shows a plot of the data you have entered, and a trend line. The yellow trend line is the exponentially weighted running average of the weight data. The scale on the left of the plot is in the weight units you have chosen. On the right is shown the corresponding BMI values. The line at the bottom presents your current weight (from the trend line, not any particular data entry), the weight lost or gained over the last week (regardless of the plot interval) and the number of excess/deficit calories per day which will produce that weight change. | ||
Revision as of 10:17, 28 February 2011
maeFat is a Maemo 5 app for the N900 which helps you to track your weight history. It is similar to the Hacker's Diet tools, but not identical to them. It allows you to log your weight, plot that data along with an exponentially weighted running average, and determine caloric excess/deficit over a variety of time intervals.
Contents |
The Initial Display
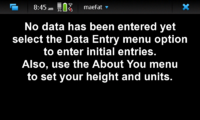
When you initially run the program, there will be no data available, and you will see the display shown on the right. You must either enter data through the app, or copy a data file of your own into the proper location. Also, you must use the Settings menu option in order to enter your height (which is used to calculate your Body Mass Index (BMI).
Menu
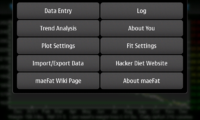
The image to the right shows the maeFat menu. To enter data, select the Data Entry option. The Log option allows you to edit entries which have already been entered. The Time Analysis option displays statistics about the data which has been entered. The Settings option allows you to change how the program operates, for example whether or not metric units are used. The Help option displays this page in the unit's web browser, and the About options shows a page containing copyright and other information about the program.
Data Entry
The Data Entry page allows you to enter new weight data. It does that without requiring you to use the N900's keyboard. It contains hildon Date and Time widgets preloaded with the current time and date. You can use these to change the time tag for the weight data you are entering, if you don't want to use the current time. The Weight widget is used to enter the weight. If no data has yet been entered, it will be preloaded with 150 pounds (unless you chosen metric units), otherwise it will be preloaded with the most recent weight entry. The comments widget allows you to tag the entry with a text comment. If you press the arrow at the upper right corner (the normal way to exit a page) the new data will be entered into the log. If you decide that you don't want to make an entry, push the Cancel Data Entry button.
Settings
The Settings page allows you to change how the program operates. It must be used initially to enter your height. Before entering your height, you should select centimeter units if that's what you wish to use (rather than inches). You may also select metric units for weight, and the format for displaying the dates. If you select nonjudgemental colors, neutral colors will be used to display the data, otherwise green will be used to indicate weight loss, red will be used for weight gain, and the BMI data will be color coded. The last thing the Settings page allows you to set is the time interval used to produce the default plot page.
Plot Page
The program's default page shows a plot of the data you have entered, and a trend line. The yellow trend line is the exponentially weighted running average of the weight data. The scale on the left of the plot is in the weight units you have chosen. On the right is shown the corresponding BMI values. The line at the bottom presents your current weight (from the trend line, not any particular data entry), the weight lost or gained over the last week (regardless of the plot interval) and the number of excess/deficit calories per day which will produce that weight change.

